Real-Time Analytics Dashboard
Your practice, fully visible.
Get a complete picture of your practice in one place. Monitor session trends, revenue flow, appointment activity, and provider performance — with live charts and exportable reports built for confident decision-making.
Real-Time Data
Export to PDF & CSV
Multi-Provider Support
6
Dashboard Views
Live
Real-Time Charts
1-Click
Report Export
Complete Analytics Suite
Everything you need to run your practice
Six dashboard views covering every aspect of your practice operations
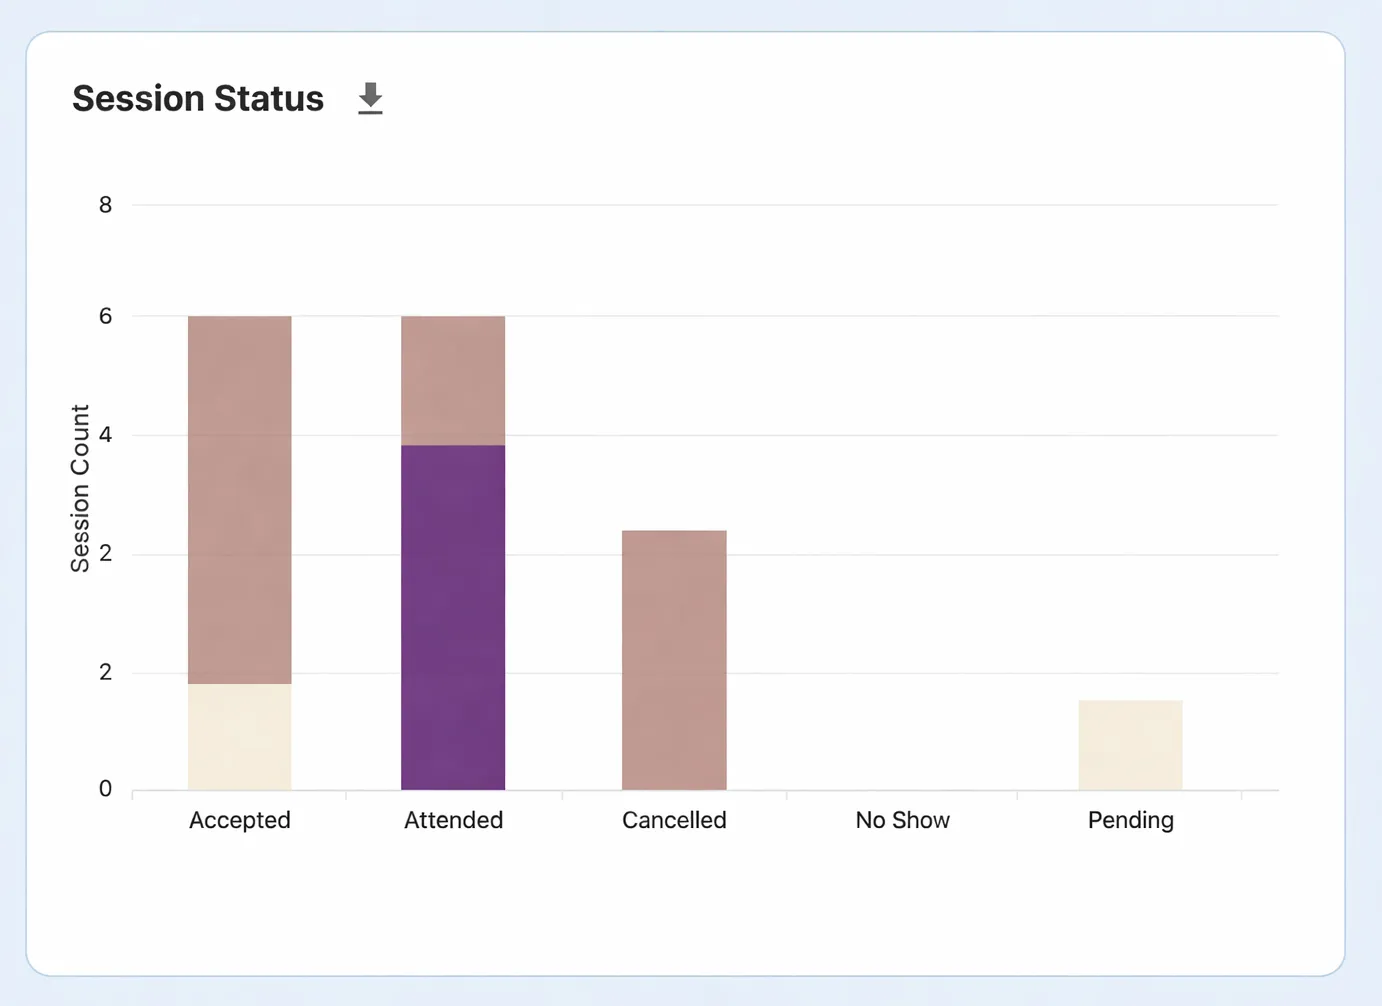
Session Analytics
Track completed, cancelled, and no-show sessions with real-time stats, percentage changes, and status breakdowns.
Appointment Insights
Revenue by provider and service, payment summaries, pie charts, and weekly bar graphs — all filterable by date range.
Practice Overview
Projected revenue, actual financials, session types, attendance rates, and performance projections in one view.
Provider Management
Provider distribution, total clients, active vs inactive counts, and per-provider performance metrics.
Clinical Overview
Client demographics, age distribution, referral sources, intake status, and registered client tracking.
Spreadsheet Export
One-click export to .xlsx from any dashboard view.
Analytics Dashboard
Everything in one place.
Real-time dashboards for sessions, revenue, clinical data, and documentation — all in a single view.
Sessions
Session tracking, live.
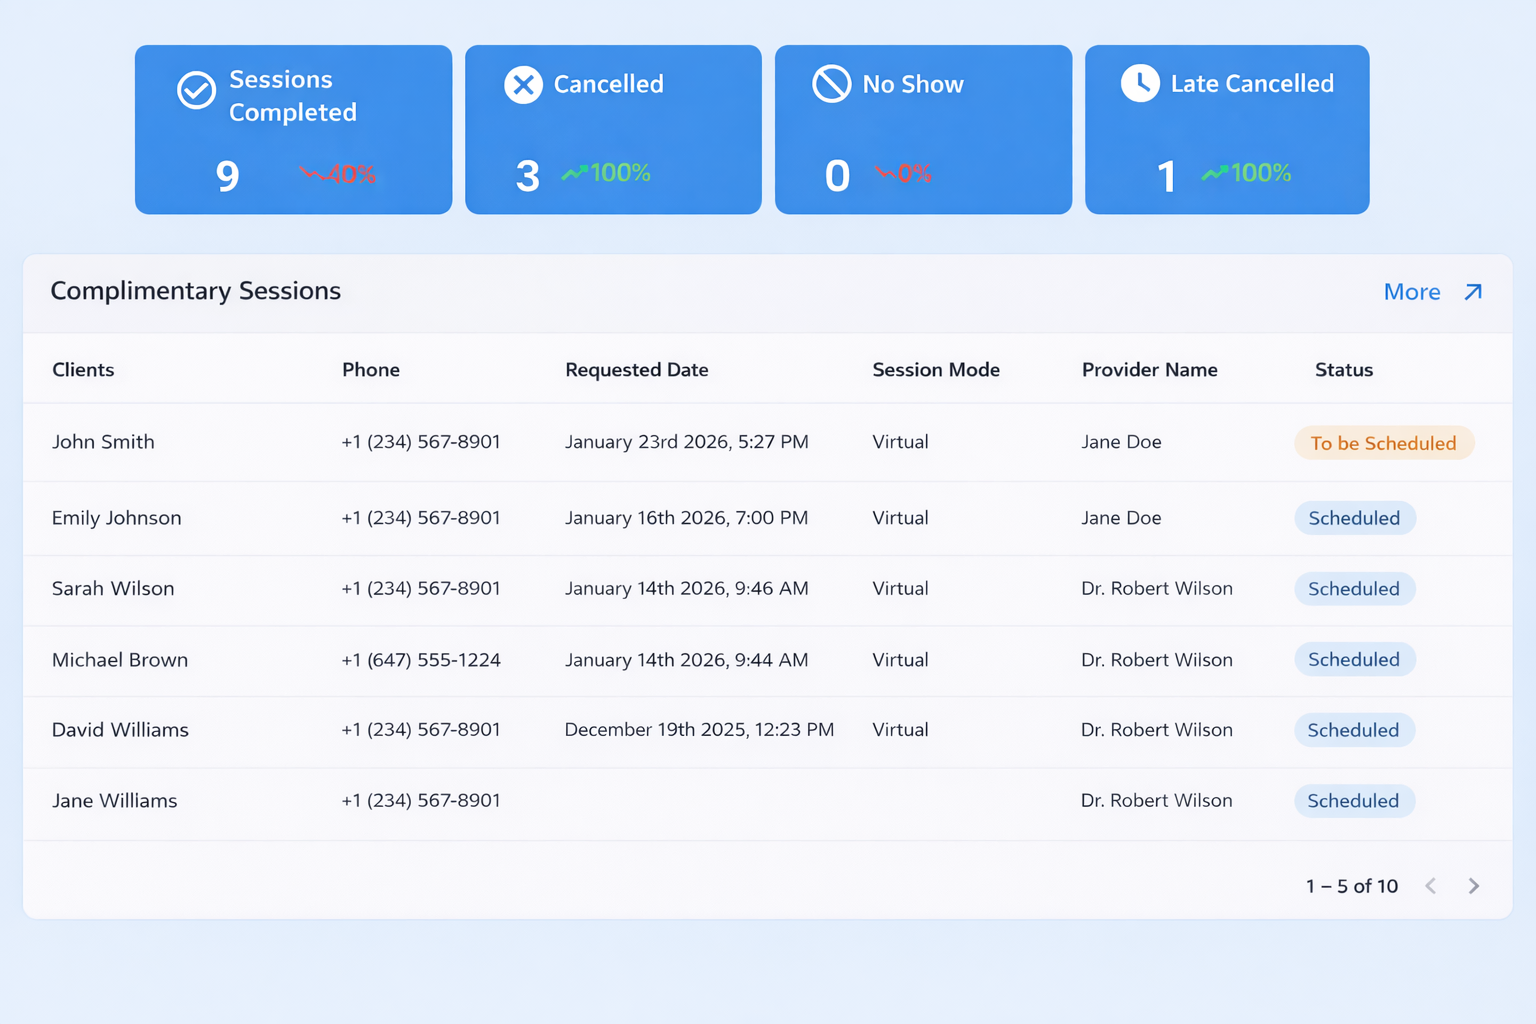
Completed, cancelled, and no-show counts with trend percentages. Filter by provider, type, or location.
Status CardsTrend %Session Table
Sessions
Session tracking, live.
Completed, cancelled, and no-show counts with trend percentages. Filter by provider, type, or location.
Status CardsTrend %Session Table
How It Works
Insights in four steps.

Real-time analytics
6 views, one dashboard
01
Open Dashboard
Navigate to your Admin Dashboard. All six analytics views are accessible from the top tab bar.
One-click accessTab navigation
02
Filter & Customize
Choose providers, session types, locations, and date ranges. Apply filters to drill into the data that matters.
Multi-filterDate ranges
03
Visualize Insights
View real-time charts, status cards, tables, and pie graphs. Switch between tabs for different perspectives.
ChartsReal-time
04
Export Reports
Export any view to Excel with one click. Full data preservation for compliance, billing, or team meetings.
Excel ExportPrint Ready
Ready to See Your Practice Analytics?
Session tracking, revenue analytics, provider management, clinical insights, and Excel exports — everything you need, nothing you don't.
6 dashboard views
One-click Excel export
Real-time data