
How to Use Genogram Templates in Psychotherapy
Listen to this post
Listen to this post
A Practical Guide
What a genogram is, how to draw one, a worked example, and how to put a ready-made template to use with your clients.
Key takeaways
• A genogram is a map of a family across three or more generations — not just who’s related to whom, but the emotional patterns, losses, and relationships that shape a client’s present.
• The notation is standardized (squares, circles, specific relationship lines), which means a genogram you draw is one any trained colleague can read.
• You can build one by hand in a session; a template just removes the setup friction and keeps the symbols consistent.
• Used well, a genogram is a shared visual that surfaces intergenerational patterns — though it’s a clinical aid, not a diagnosis.
A client describes the same painful loop they keep landing in — distant with their partner, then anxious, then distant again — and somewhere in the telling they mention, almost in passing, that their mother and grandmother both did exactly the same thing. You feel the click of recognition. The pattern isn’t just theirs; it has a history. The hard part is holding all of it in your head at once: who’s who, who’s close to whom, what got passed down, and where this client sits inside it.
That’s the problem a genogram solves. It takes the sprawling, multi-generational story a client carries and puts it on a single page you can both look at. This guide covers what genograms are and why they help, how to draw one step by step, a worked example you can read at a glance, and how to get the most out of a ready-made template.
What are genograms, and how can they be useful in psychotherapy?
A genogram looks a bit like a family tree, but it does more. A family tree records who descended from whom. A genogram adds the things a clinician actually cares about: the quality of relationships, significant health and mental-health history, losses, substance use, conflict and closeness — the emotional information that helps explain how a family system works.
The tool comes out of family systems thinking. Psychiatrist Murray Bowen developed the approach in the 1960s and ’70s, and Monica McGoldrick and Randy Gerson later turned it into the standardized clinical notation most practitioners use today. The premise is that people don’t develop in isolation; patterns of anxiety, closeness and distance, and ways of coping get transmitted across generations, and seeing those patterns laid out can be clarifying.
In practice, clinicians reach for genograms to:
• Assess and conceptualize. Mapping three generations often surfaces recurring themes — depression, addiction, estrangement, early loss — that inform how you understand the presenting concern and plan treatment.
• Spot intergenerational patterns. Seeing the same dynamic repeat across generations can turn a vague sense of “this runs in my family” into something concrete to explore.
• Build rapport and insight together. Drawing the genogram with a client is collaborative and often engaging; many people find it illuminating to see their family on paper.
• Track change over time. Some clinicians revisit a genogram across treatment, noting where relationships have shifted, as one informal marker of progress.
A fair caveat: a genogram is a clinical aid, not a diagnostic instrument. It organizes information and generates hypotheses; it doesn’t interpret itself, and what it surfaces still depends on your clinical judgment and the client’s own meaning-making.
How to create a genogram
You can draw a genogram on paper, a whiteboard, or in software. The steps are the same.
1. Start with the index person. This is the client (sometimes called the identified patient). Place them toward the center-bottom so there’s room for older generations above. Draw a square for male, a circle for female, and a diamond when gender is unknown or a person prefers it. The index person is usually marked with a double outline.
2. Add their generation. Place siblings beside the index person and a partner alongside, connecting partners with a relationship line. Convention puts the older sibling on the left, the male partner on the left and female on the right — small consistencies that make the map easy to read.
3. Build upward, generation by generation. Add parents above, then grandparents above them. Aim for at least three generations; fewer tends to be too thin to reveal patterns. Use vertical lines to connect children to their parents.
4. Mark key facts. Add birth and death years, an X through anyone who has died, and dates for marriages, separations, or divorces (a divorce is shown with two slashes across the relationship line). Note significant health, mental-health, or substance-use history where you know it.
5. Layer in relationship quality. This is what sets a genogram apart from a family tree. Use relationship lines to show emotional patterns — close, distant, conflictual, or cut off. These lines are where the clinically interesting story often lives.
6. Step back and look for patterns. With the structure down, study it together. What repeats? Where are the cutoffs, the over-close bonds, the clustered losses? These observations become material for the work, not conclusions in themselves.
A practical note on relationship lines: there are more symbols than anyone uses in a single session. Start with the handful you’ll actually reach for — close, distant, conflict, cutoff — and add detail only where it earns its place. A cluttered genogram is harder to read than a simple one.
Genogram examples
Here’s a worked example. It shows three generations of a fictional family, the Bennetts, with the client (Emma) marked as the index person.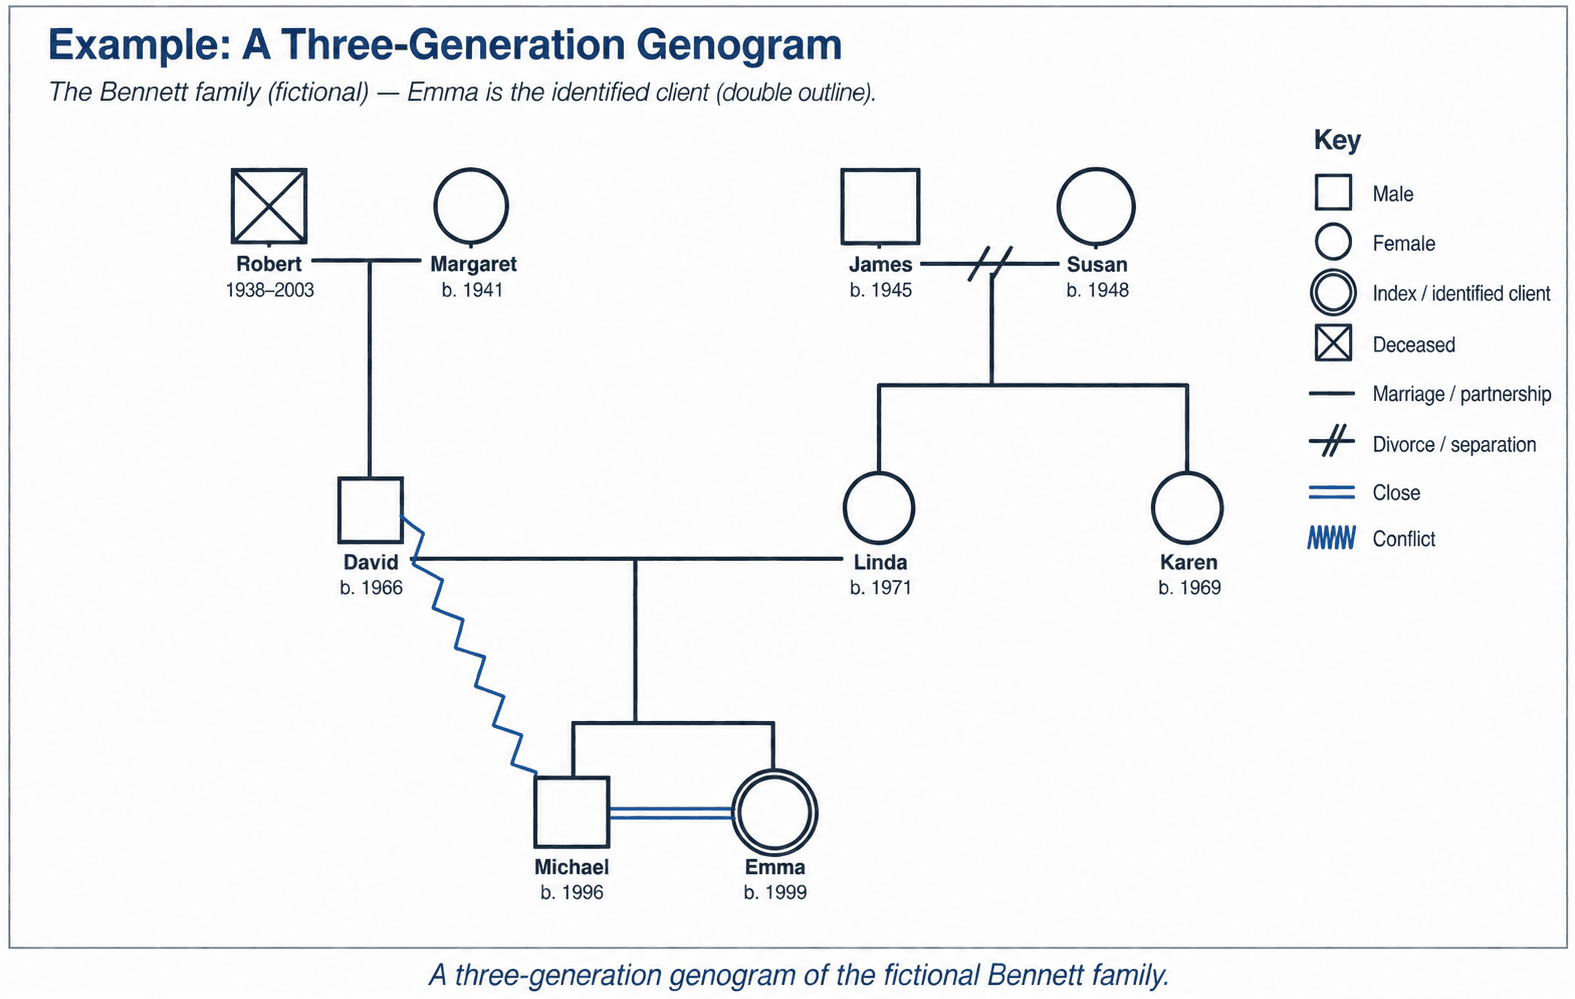
Reading it top to bottom: Robert and Margaret are the paternal grandparents — Robert has died, shown by the X. James and Susan are the maternal grandparents, and the two slashes on their line mean they divorced. Their daughters are Linda and her sister Karen. Linda married David, and they have two children: Michael and Emma, the identified client (note her double outline).
The structure alone is useful, but the relationship lines tell the clinically interesting part. The jagged line between David and his son Michael marks a conflictual relationship; the double line between Michael and Emma marks a close sibling bond. Already a few questions suggest themselves: How does the parents’ divorce in one generation echo in the next? What does Emma’s closeness with her brother do for her amid tension with their father? None of these are answers — they’re the kind of hypotheses a genogram is good at prompting.
You don’t need every detail at once. A first-pass genogram with structure, a few dates, and two or three relationship lines is often more useful than an exhaustive one nobody can read.
How to use genogram templates
A template doesn’t change the method; it removes the friction. Instead of setting up symbols and generational rows from scratch, you start with a clean, consistent frame and a symbol key already on the page. A few ways to get the most from one:
• Have it ready before the session. Printing the template ahead of time means you can begin mapping the moment it’s relevant, rather than pausing to draw a grid.
• Draw it with the client, not for them. The collaboration is part of the value. Narrate what each symbol means as you go; many clients find the process itself revealing.
• Use the key to stay consistent. A legend on the template keeps your notation standard, so the genogram stays readable to you later and to any colleague involved in the client’s care.
• Treat the first version as a draft. Families are complicated, and details surface over time. Expect to revise — and consider keeping a copy in the client’s record so you can update it as the work continues.
• Mind privacy. A genogram holds sensitive information about people who aren’t your clients. Store and share it with the same care you’d give any part of the clinical record, in line with your privacy obligations.
The blank template included with this post is set up for three generations, with a symbol-and-line key built in. It’s a starting frame, not a worksheet to complete in one pass.
Where your tools can help
A genogram is only as useful as it is accessible when you need it. Keeping it with the rest of a client’s chart — rather than in a drawer or a separate file — means you can glance at it before a session, update it as new history surfaces, and reference it in your notes. In NousTalk, you can store a scanned or photographed genogram alongside a client’s record and document your observations in the same place as your session notes, so the map and the work it informs stay together.
The bottom line
A genogram turns a tangled family history into something you and a client can see and think about together. The notation is simple enough to learn in an afternoon, and a template removes the setup so you can focus on the conversation rather than the drawing. Pick one client whose family story keeps surfacing, print the template, and try mapping three generations in your next session. You may find the picture says something the words hadn’t yet.
Download the template
Included with this post:
•
(Print-ready PDF, designed to use in session. The notation follows the McGoldrick, Gerson & Petry standard.)
Further reading / Sources
• Genogram in Couple and Family Therapy — Encyclopedia of Couple and Family Therapy, Springer
• The Bowen Center for the Study of the Family — Bowen family systems theory
• Focused Genograms: Intergenerational Assessment of Individuals, Couples, and Families — Routledge
This article is for general educational purposes and isn’t a substitute for clinical training, supervision, or your own clinical judgment. Genogram practice is best learned through training; handle the family information a genogram contains in line with your scope of practice and your college, board, or association’s privacy standards.
Circle of Care & Family Assessment
Link family records and collaborative care plans in one portal.
Explore Feature Page